Temperature Anomaly Metrics
The data used in this analysis is from Climate Reanalyzer.
Their “1979-2000 Average” was adjusted upward by 0.58°C so that the average temperature anomaly in 2023 (since “pre-industrial times”)
matched that of the European Meteorological Service (about 1.48°C). The “El Niño average” in the graphs below refers to the average anomalies of most of the major El Niño events
since 1955 (2023 was the start of a major El Niño event). Table 2 lists some of the more important temperature anomaly metrics.
The temperature anomaly over the last 365 days was about 1.51°C and will likely stay above that amount for at least the next 4-5 months.
Based just on historical data, it is too early to tell if the temperature anomaly for 2024 will be above or below 1.5°C. |
|
| Time Period | Average Temperature Anomaly (°C) |
|---|
| All of 2023 | 1.48 |
| December 2023 | 1.70 |
| Jan 1, 2024 | 1.68 |
| Feb 15, 2024 | 1.72 |
| Year-to-Date (thru Feb 15, 2024) | 1.66 |
| Last 365 days (thru Feb 15, 2024) |
1.54 |
| Table 2 Temperature Anomaly Metrics |
|---|
Screenshots of temperature data from the Climate Reanalyzer web site.
Both the daily air and sea surface temperatures continue greatly exceed those in 2023.
Note that the January 25th sea surface temperature has already exceeded the maximum 2023 value, where the peaks occurred in April and August.
|

|
 |
 |
 |
| Graphs of the Temperature Anomalies for 2023 and 2024 |
 |
|
The temperature anomaly on January 25th was under 1.5°C, having dropped about 0.2°C during the month. |
| On average, during a major El Niño event, the temperature anomaly increased by about 0.3°C in the first year and decreased by about 0.2°C in the second year. |
 |
 |
|
During previous El Nino events the average temperature anomaly increased in during January of the second year but then decreased for the rest of the year.
That does not appear to be happening in 2024 as the temperature anomaly decreased during January. |
| Historical Temperature Anomalies
|
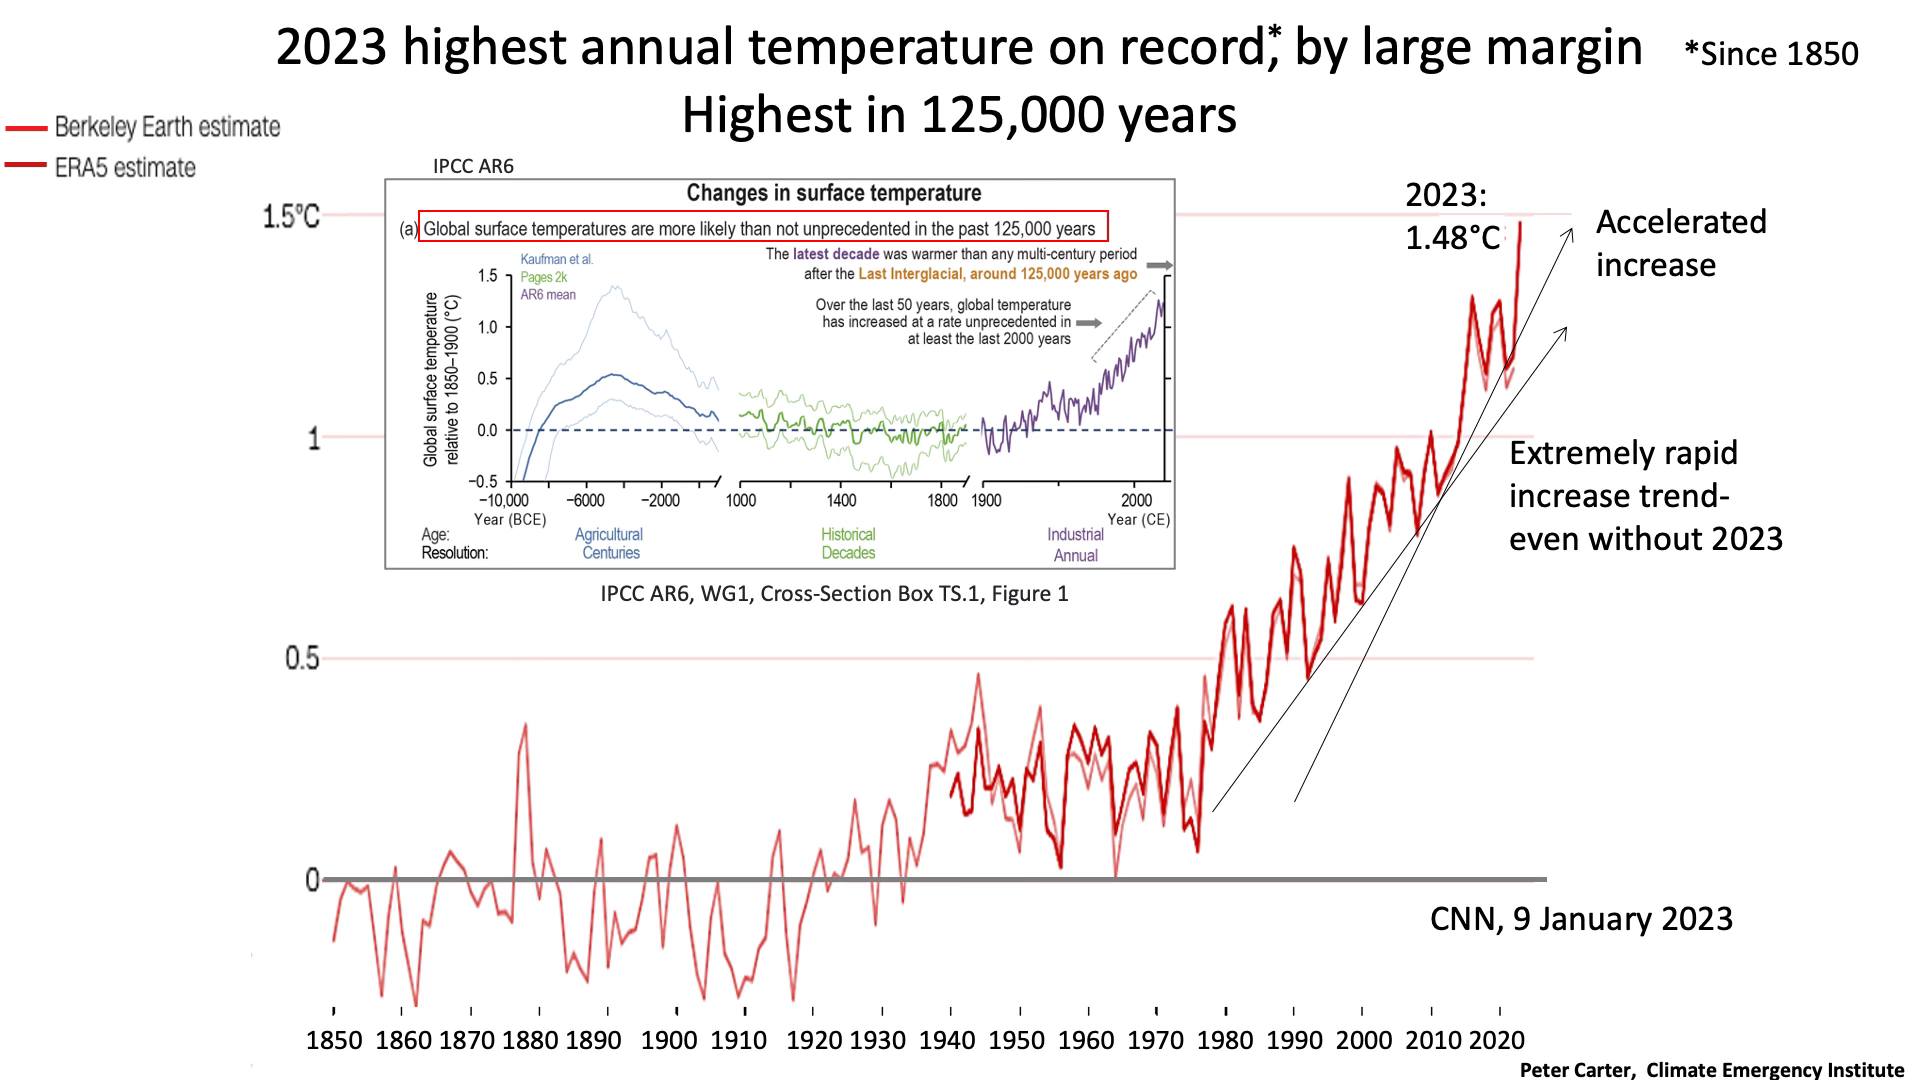 | |
| Source: Peter Carter - Posted on Facebook | |
|